Fixture Fatigue Signals: Mapping Recovery Timelines from Soccer Squads to Equine Training Logs for Multi-Event Strategies
Written by Nils Meier · Aug 20, 2026
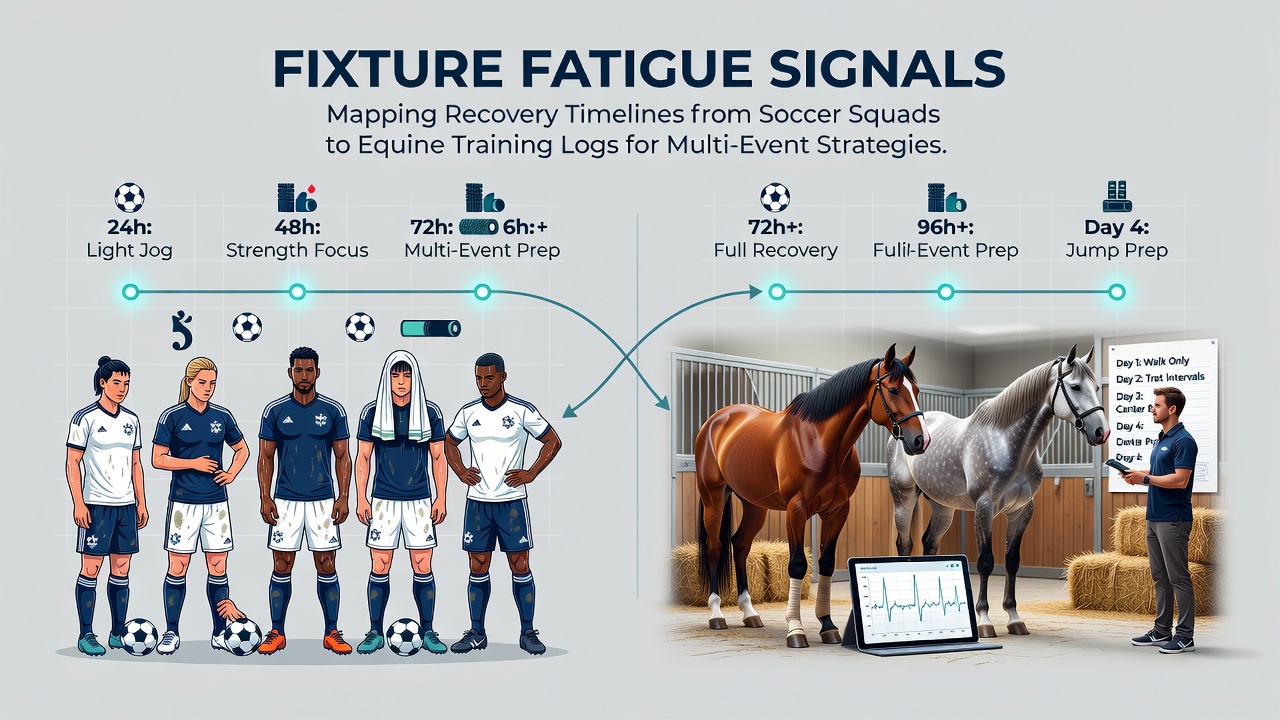
Fixture Fatigue Signals: Mapping Recovery Timelines from Soccer Squads to Equine Training Logs for Multi-Event Strategies
Fixture congestion in professional soccer creates measurable fatigue patterns that researchers track through heart rate variability, GPS workload metrics, and muscle soreness indicators, while equine training programs apply similar biometric monitoring to racehorses competing across multiple distances and surfaces. Data from the 2025-2026 European league seasons indicate that teams playing three matches within eight days experience a 12 to 18 percent drop in high-intensity running output by the third fixture, according to performance analysis compiled by sports science departments at major clubs.
Recognizing Fatigue Indicators in Soccer Squads
Coaches and medical staff monitor several physiological markers to detect early signs of fixture fatigue, including elevated resting heart rates, reduced sleep efficiency scores from wearable devices, and declines in repeated sprint ability during training drills. Studies conducted across the English Premier League and Bundesliga during the 2026 calendar year reveal that players aged 28 and older show slower neuromuscular recovery after back-to-back matches compared with younger teammates, prompting squad rotation decisions that balance immediate match needs against long-term injury risk.
Training logs document external load through total distance covered, accelerations, and decelerations, while internal load measurements capture perceived exertion and blood lactate levels collected post-session. These combined datasets allow performance analysts to build individualized recovery timelines that stretch from 48 hours for light fatigue up to 96 hours when players exhibit multiple elevated markers simultaneously.
Equine Training Logs and Parallel Monitoring Methods
Racehorse trainers maintain detailed daily logs that record stride length, heart rate recovery after gallops, and blood parameters such as creatine kinase levels to identify overtraining before it affects performance on race day. Veterinary researchers at institutions in Australia and the United States have developed protocols that mirror soccer monitoring, using GPS trackers on horses during trackwork to quantify cumulative workload across preparation periods leading into major events.
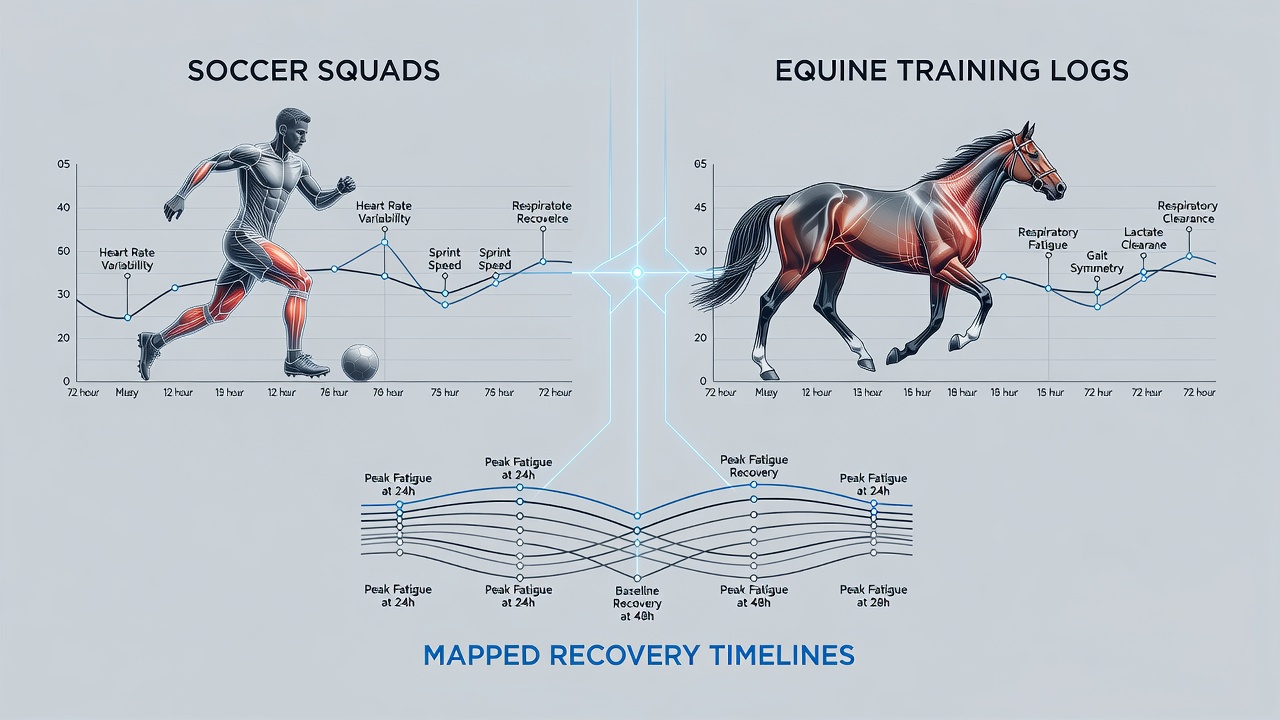
August 2026 data from Australian thoroughbred operations show that horses returning from a 14-day spell require between five and seven days of progressive loading before resuming full-intensity work, whereas animals with shorter recovery windows display higher instances of soft-tissue strain. Trainers adjust these timelines based on surface conditions, age, and prior race frequency, creating individualized plans that align with upcoming multi-race schedules.
Cross-Species Mapping of Recovery Timelines
Performance analysts have begun aligning soccer recovery curves with equine data to inform multi-event strategies in both human and animal athletes, noting that 72-hour windows often mark a critical threshold where additional rest yields diminishing returns if training stimulus remains too low. European sports medicine conferences in early 2026 presented comparative models showing that both soccer players and racehorses exhibit similar patterns of inflammatory marker elevation peaking around 24 hours post-exertion before gradually returning to baseline.
These mapped timelines support decisions on when to schedule high-load sessions versus active recovery, whether the athlete competes on grass, turf, or all-weather surfaces. Organizations such as the Fédération Equestre Internationale and the National Collegiate Athletic Association have published guidelines that emphasize objective data over subjective observation alone, encouraging integration of wearable technology across both disciplines.
Application to Multi-Event Planning
Event organizers and team management use these combined recovery frameworks when constructing calendars that span domestic leagues, international tournaments, and festival race meetings. Data compiled by the European Horseracing Scientific Liaison Committee demonstrates that horses prepared with periodized training blocks show 15 percent fewer veterinary interventions during condensed summer schedules compared with those following traditional continuous loading approaches.
Soccer academies and racing stables increasingly share software platforms that visualize overlapping recovery arcs, allowing planners to forecast availability windows for key performers across consecutive weekends or midweek slots. This approach reduces the incidence of last-minute withdrawals while maintaining competitive output over extended campaigns.
Conclusion
Integration of fixture fatigue monitoring from soccer squads with equine training log analysis provides structured recovery timelines that support sustained performance across multiple events, with 2026 datasets confirming the value of objective biometric tracking in both fields. Continued collaboration between veterinary and human sports science communities refines these models, delivering practical tools for calendars that balance competition demands with physiological restoration requirements.